Transaction Analytics
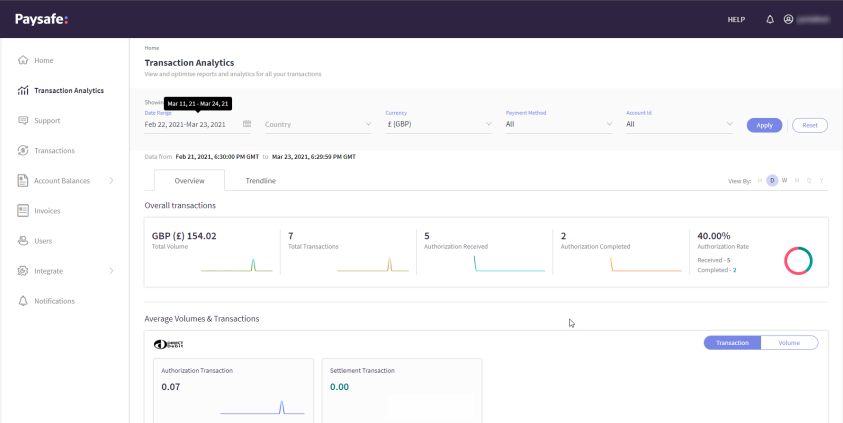
The Transaction Analytics page provides a visual representation of all your business transactions in the form of pre-built dashboards. The Transaction Analytics screen has two tabs – Overview and Trendline.
-
In the Overview tab, you can view two main sections - Overall Transactions and Average Volumes & Transactions. The Average Volumes & Transactions section contains data segregated by different payment methods.
-
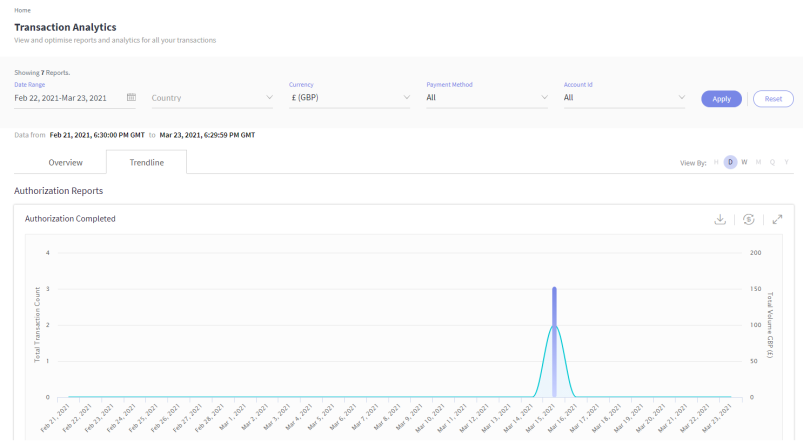
In the Trendline tab, you can view different pre-built KPI reports like authorization, declined, payments footprint, and transaction status reports.
This article talks about:
In Transaction Analytics module, you can view transactions made in all payment methods.
Apply Filters
You can apply a range of filters like dates, countries, currencies, payment methods, and processing account ids and customize the reports. The reports obtained from Paysafe contain data about your transactions that are more than 24 hours old.
-
Select options from the available filters.
-
Click Apply. Alternatively, click Reset to clear the selection in the filters. By default, data from the last 14 days is populated.
-
Select a Reporting Currency from the list. Once you select a currency, you can see the transactions in the selected currency. Reporting Currency - This is the currency the merchant can select to view their data/transactions in a single currency. Suppose a merchant processes in multiple currencies, selecting EUR in reporting currency field shows all their transactions in EUR in an aggregated view. In the case, a further drill-down into the transaction shows the processing currency.
Note: If historical data is not present for the metric, the trend graph does not populate.
Overview
The Overview tab gives you a visual representation of your Overall transactions, Average Volume, and Transactions.
You can also view the graphs by the hour, day, week, month, quarter, and year using the View By field.

Overall Transactions
-
The Overall Transactions section displays a small trend graph, indicating if the performance has gone up or down.
-
A green arrow indicates improvement, and red shows decline.
-
This section also shows the number of total transactions, the number of authorization received, and the number of authorization completed. At the end of this section, you can see the authorization rate of the transactions.
Average Volumes & Transactions
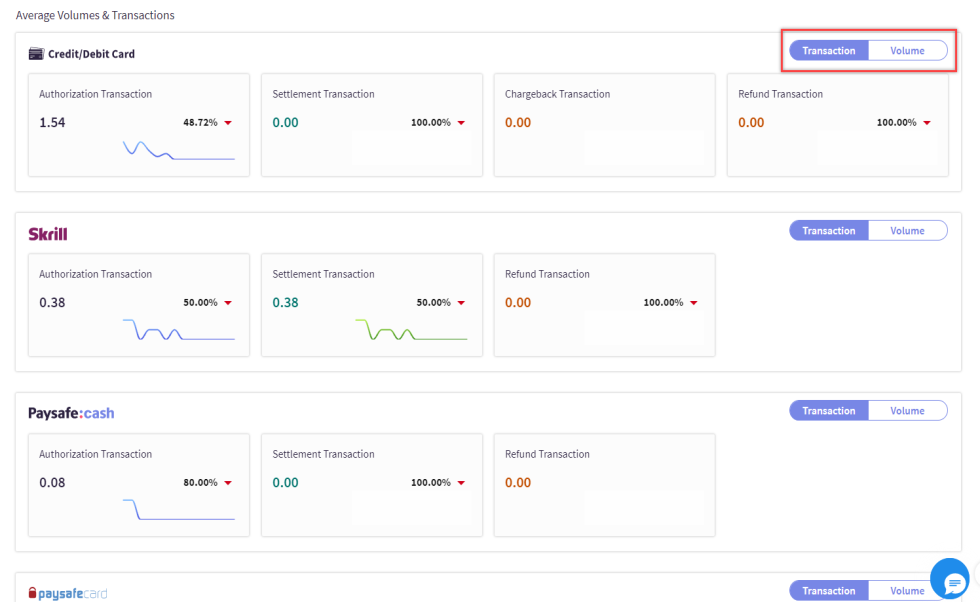
The Average Volumes & Transactions section shows a visual view of all the payment methods you have integrated with the Business Portal. Depending on the payment methods you have integrated, different areas corresponding to each payment method appear with the average transaction metrics. The following image shows different payment methods like Credit/Debit Card, Skrill, Paysafe Cash, and Paysafe Card. The Transaction/Volume toggle allows you to switch the view between average transaction count and volume metrics.

View Trendline Reports
The Trendline tab consists of a set of graphs built on transaction data. You can download, see the transactions source for all the reports. The Trendline charts available on the Business Portal currently are:
- Authorization Completed
- Authorization Volume
- Card Schemes
- Card Category
- Declined transactions by payment method
- Payments Footprint
- Transaction Status Reports
To analyse the Trendline reports:
-
Select the required filters from the Date Range, Country, Currency, Payment Method, Account Id fields.
-
Click Apply.
-
Select a View By option. The available options are Day, Week, Month, Quarter, and Year.
-
Select a Reporting Currency. This is the currency the merchant can select to view their data/transactions in a single currency. Suppose a merchant processes in multiple currencies, selecting EUR in reporting currency field shows all their transactions in EUR in an aggregated view. In that case, a further drill-down into the transaction shows the processing currency.

Download the Reports
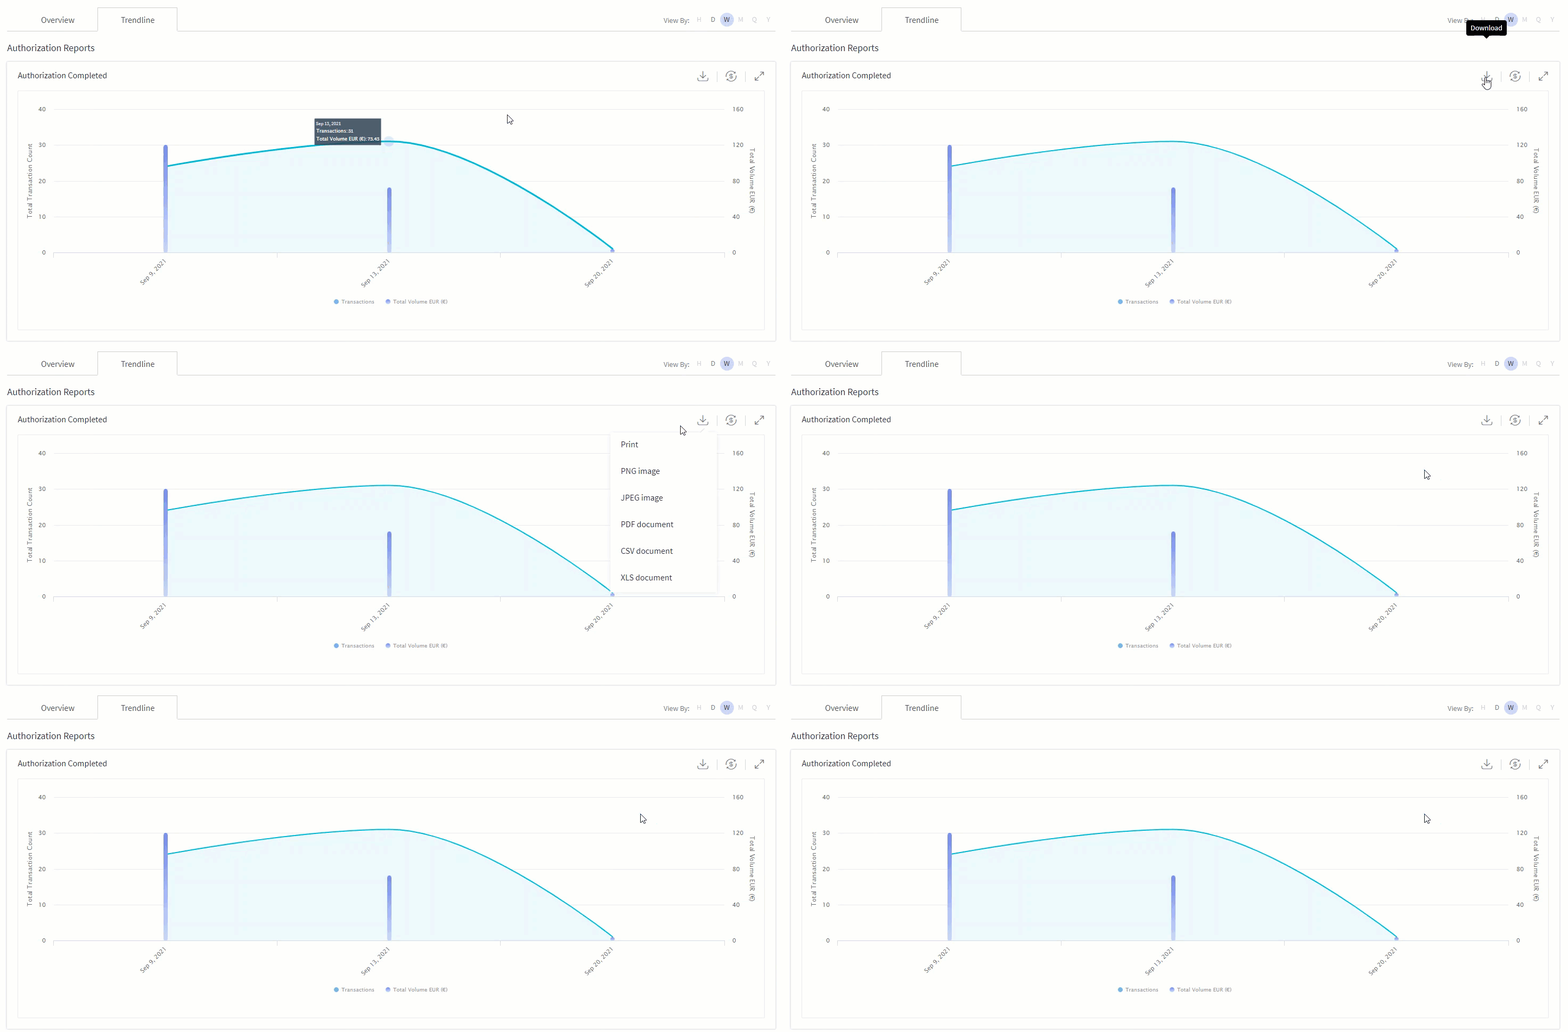
You can download all the reports in the Trendline section. You can download the graphs in different formats like PNG, JPEG, PDF, CSV, and XLS.

View the transactions of a Report
Using the Transactions button, you can view the source of the graph. You will be redirected to the Transactions module in the Business Portal to view the transaction records that constitute this graph. all the filters applied in transaction analytics get auto applied in Transactions module as well.